 # License
```python
# Code source: Gaël Varoquaux
# Andreas Müller
# Modified for documentation by Jaques Grobler
# License: BSD 3 clause
```
# License
```python
# Code source: Gaël Varoquaux
# Andreas Müller
# Modified for documentation by Jaques Grobler
# License: BSD 3 clause
```
Imports
First we bring in NumPy and our godforsaken matplotlib dependencies.
import matplotlib.pyplot as plt
import numpy as np
from matplotlib.colors import ListedColormap
The ListedColormap takes a HxW array of color indices from
Next, we bring in methods for initializing dummy data.
- make_classification does not actually classify; it creates data points and labels corresponding to linearly separable classes.
- make_circles creates a noisy dataset consisting of two concentric circles, with each circle representing a class.
- make_moons creates noisy, interleaved half-circles, with each half-circle representing a class.
from sklearn.datasets import make_circles, make_classification, make_moonsAfter this, we bring in a whole bunch of classifiers. The goal will be to visually compare how they do.
from sklearn.discriminant_analysis import QuadraticDiscriminantAnalysis
from sklearn.ensemble import AdaBoostClassifier, RandomForestClassifier
from sklearn.gaussian_process import GaussianProcessClassifier
from sklearn.gaussian_process.kernels import RBF
from sklearn.inspection import DecisionBoundaryDisplay
from sklearn.model_selection import train_test_split
from sklearn.naive_bayes import GaussianNB
from sklearn.neighbors import KNeighborsClassifier
from sklearn.neural_network import MLPClassifier
from sklearn.svm import SVC
from sklearn.tree import DecisionTreeClassifier
Finally, we bring in some utilities. make_pipeline lets you chain multiple models together into a single “trainable” object. StandardScaler independently centers to the mean and scales to unit variance.
from sklearn.pipeline import make_pipeline
from sklearn.preprocessing import StandardScaler
Set up comparison
The classifiers have unique constructor arguments, but compatible fit/predict APIs. It would have been nice to do this as an ordered dictionary, but whatevs.
names = [
    "Nearest Neighbors",
    "Linear SVM",
    "RBF SVM",
    "Gaussian Process",
    "Decision Tree",
    "Random Forest",
    "Neural Net",
    "AdaBoost",
    "Naive Bayes",
    "QDA",
]

classifiers = [
    KNeighborsClassifier(3),
    SVC(kernel="linear", C=0.025, random_state=42),
    SVC(gamma=2, C=1, random_state=42),
    GaussianProcessClassifier(1.0 * RBF(1.0), random_state=42),
    DecisionTreeClassifier(max_depth=5, random_state=42),
    RandomForestClassifier(
        max_depth=5, n_estimators=10, max_features=1, random_state=42
    ),
    MLPClassifier(alpha=1, max_iter=1000, random_state=42),
    AdaBoostClassifier(algorithm="SAMME", random_state=42),
    GaussianNB(),
    QuadraticDiscriminantAnalysis(),
]
Initialize dataset
Now we create some toy data. Comments are mine.
# Create a linearly separable two-class dummy dataset for classification.
X, y = make_classification(
    n_features=2, n_redundant=0, n_informative=2, random_state=1, n_clusters_per_class=1
)

# Add some noise to it.
rng = np.random.RandomState(2)
X += 2 * rng.uniform(size=X.shape)

# Define it as a tuple.
linearly_separable = (X, y)

# Create two more datasets and put all three datasets into a list.
datasets = [
    make_moons(noise=0.3, random_state=0),
    make_circles(noise=0.2, factor=0.5, random_state=1),
    linearly_separable,
]
Create comparison visualization
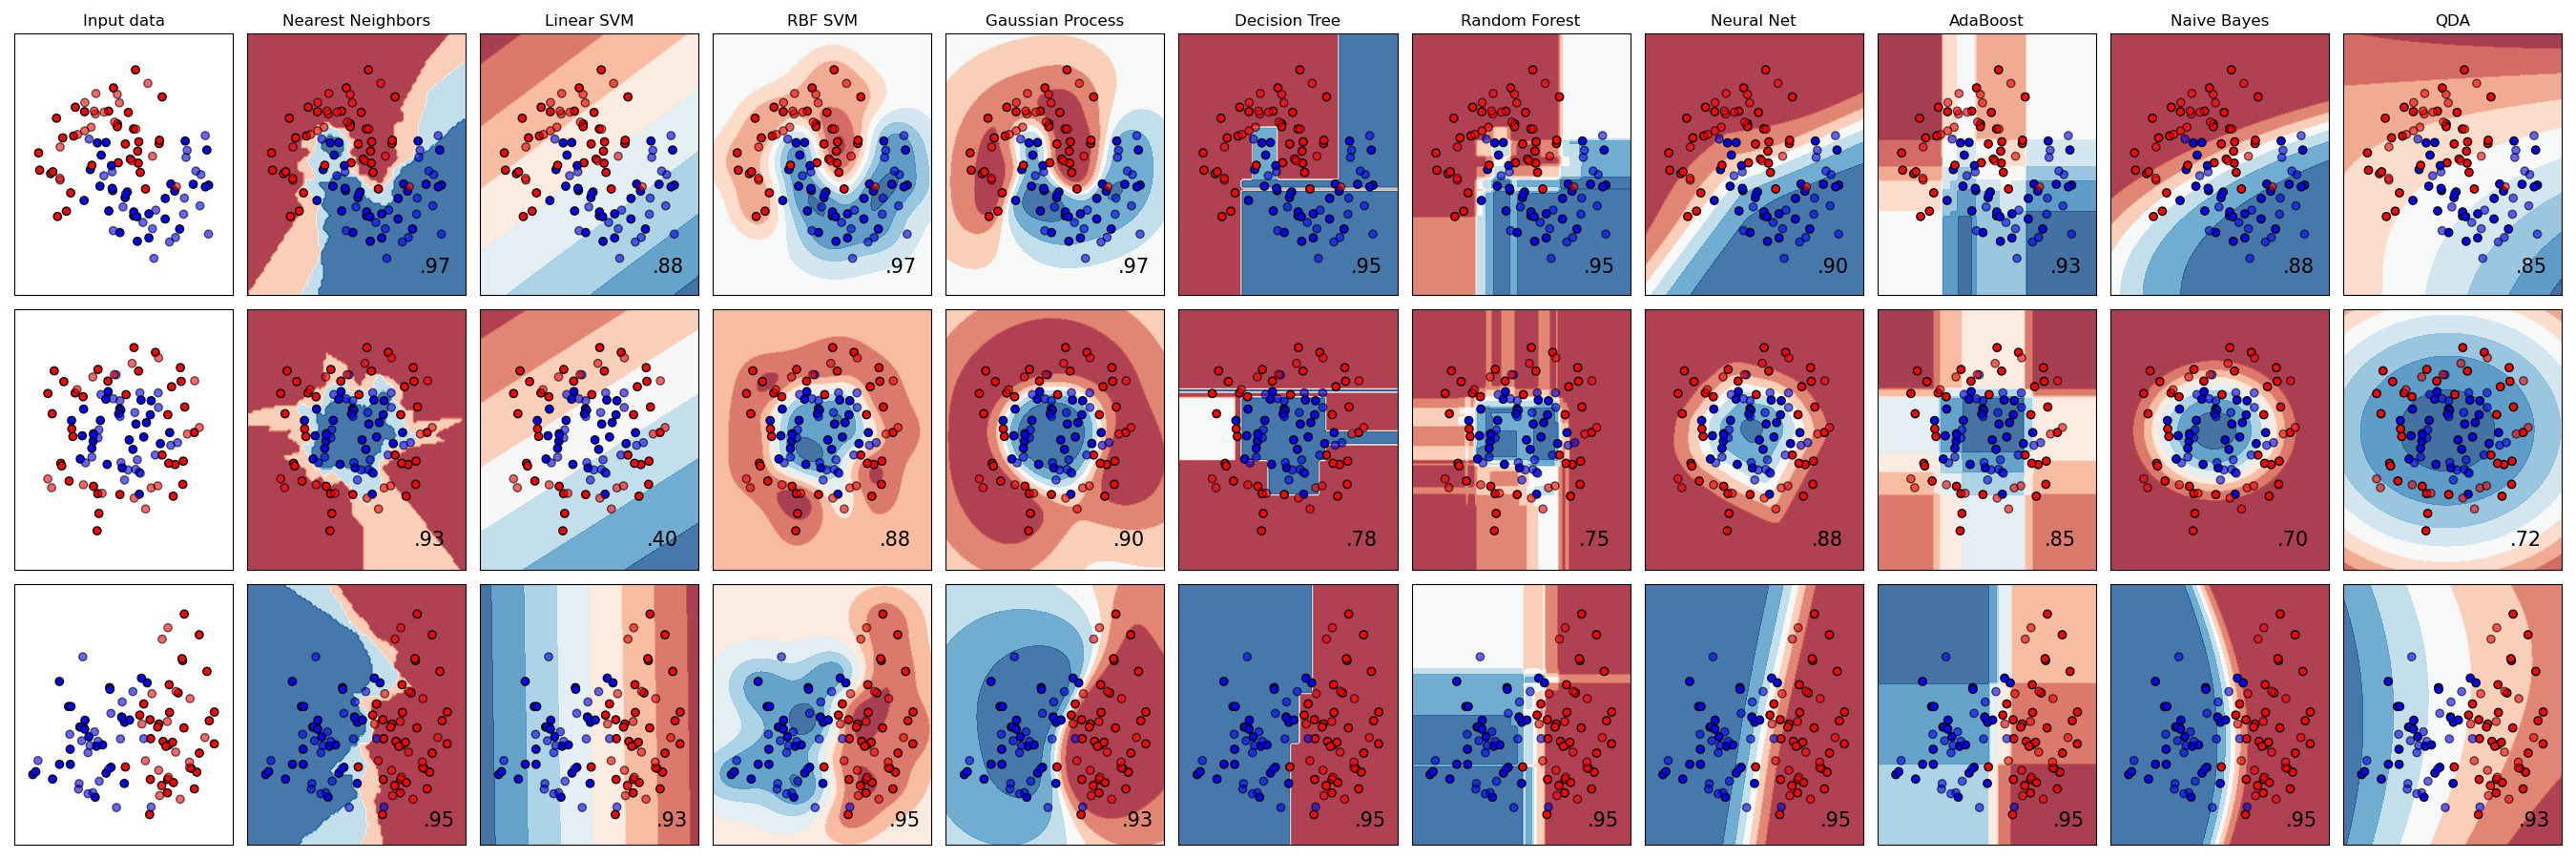
Next, we start to create a visualization. This consists of two nested loops, so I’m going to break it into three chunks.
Outermost block
# Initialize the "artist" object where the plots will live
figure = plt.figure(figsize=(27, 9))
i = 1

# Give each of the three toy datasets an index and loop over them
for ds_cnt, ds in enumerate(datasets):
	...
Outer loop
The following code runs once for each dataset (moons, circles, linearly separable classes).
First, we set up the data we’re going to be working with.
# Unpack the dataset tuple into examples and labels
X, y = ds

# Split into test and training data
X_train, X_test, y_train, y_test = train_test_split(
	X, y, test_size=0.4, random_state=42
)

# Get boundaries for the plots
x_min, x_max = X[:, 0].min() - 0.5, X[:, 0].max() + 0.5
y_min, y_max = X[:, 1].min() - 0.5, X[:, 1].max() + 0.5
Next, we set up our plots. The matplotlib.cm package deals with color maps. RdBu is a color scale.
cm = plt.cm.RdBuAs noted above, ListedColormap translates pixel-wise index values to colors from a list.
cm_bright = ListedColormap(["#FF0000", "#0000FF"])This line is a bit confusing, but it eventually makes sense when you realize that, because Matplotlib is terrible, you must tell it the height and width of your facet grid every time you interact with any one facet. i gets incremented for each plot. So this line, which appears in both the inner and outer loops, designates which subplot to work with. The first plot on each line is the input data by itself, which is why i gets incremented right before the inner loop.
Note that ax is an instance of the pyplot class, which you’d never guess from the name ax, but who cares? Certainly not matplotlib.
ax = plt.subplot(len(datasets), len(classifiers) + 1, i)This is a shame. They could have handled this outside the loop.
if ds_cnt == 0:
	ax.set_title("Input data")
pyplot.scatter does what it sounds like.
ax.scatter(X_train[:, 0], X_train[:, 1], c=y_train, cmap=cm_bright, edgecolors="k")
ax.scatter(
	X_test[:, 0], X_test[:, 1], c=y_test, cmap=cm_bright, alpha=0.6, edgecolors="k"
)
Set limits and disable ticks. Do it after plotting because sure, why not make us do another thing that feels unnatural?
ax.set_xlim(x_min, x_max)
ax.set_ylim(y_min, y_max)
ax.set_xticks(())
ax.set_yticks(())
As noted, i is incremented separately from the loop and indicates which facet (subplot) to draw.
i += 1

# iterate over classifiers
for name, clf in zip(names, classifiers):
	...
Inner loop
This loop runs over classifiers and their names. Note that I rearranged some code for clarity of explanation.
See above for what’s happening with this line.
ax = plt.subplot(len(datasets), len(classifiers) + 1, i)Here we join the classifier with a scaling operation. The scaling operation still has a fit method, which causes it to find the mean and variance. The pipeline causes them to behave as a unit.
clf = make_pipeline(StandardScaler(), clf)
clf.fit(X_train, y_train)
As its name suggests, DecisionBoundaryDisplay.from_estimator creates a colored background reflecting the decision boundaries. It uses the color map that we initialized above. We will superimpose our remaining plots over it. We specify that it should draw to our subplot (ax) via the ax=ax argument.
DecisionBoundaryDisplay.from_estimator(
	clf, X, cmap=cm, alpha=0.8, ax=ax, eps=0.5
)

# Plot the training points
ax.scatter(
	X_train[:, 0], X_train[:, 1], c=y_train, cmap=cm_bright, edgecolors="k"
)
# Plot the testing points
ax.scatter(
	X_test[:, 0],
	X_test[:, 1],
	c=y_test,
	cmap=cm_bright,
	edgecolors="k",
	alpha=0.6,
)

ax.set_xlim(x_min, x_max)
ax.set_ylim(y_min, y_max)
ax.set_xticks(())
ax.set_yticks(())
if ds_cnt == 0:
	ax.set_title(name)
The score function on a SKL classifier gives the accuracy.
score = clf.score(X_test, y_test)
ax.text(
	x_max - 0.3,
	y_min + 0.3,
	("%.2f" % score).lstrip("0"),
	size=15,
	horizontalalignment="right",
)
Display the plot
plt.tight_layout()
plt.show()